Efficient irrigation improves yields, promotes plant health, and conserves resources.
Soil moisture sensors provide visibility in to the root zone, allowing managers to make informed decisions about when and how much to irrigate. While there are many different methods available for estimating irrigation demand, sensors allow for actually measuring it.
Measuring Soil Water
Soil water measurement falls in to two broad categories:
Volumetric measurement- measuring the percentage of water by volume in a given amount of soil
Tensiometric measurement- measuring the physical force holding water in the soil, measured in Centibars (or kPa) of soil water tension
IRROMETER soil moisture measurement is based on the tensiometric method, as the amount of water is less important than how difficult it is for the plant to extract it from the soil.
Soil water tension (or matric potential) has to be overcome for the plant to move water in to its root system. Different soil types will have different tensions even at the same volumetric measurement, making volumetric information relative to local conditions and often requiring site calibration for reading equipment. Because we use soil water tension, there is no site calibration required when using our sensors.
Due to the fact that tensiometers have been used in research since the 1920's and have been commercially available from us since 1951, decades of published research by numerous universities and extension agencies have produced a wide field of reference for recommended tension levels to use with common crops and landscapes.
Sensor Options
There are two methods we offer for reading soil water tension:
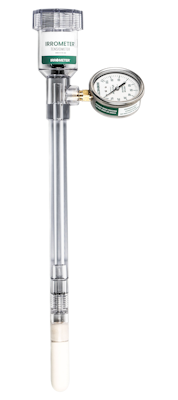
1. IRROMETER Tensiometer
The Tensiometer is the only direct measurement instrument available, which means that it measures the physical forces at work in the soil vs. indirectly measuring an electrical property as other sensors do. Tensiometers act like an artificial root, interacting with the soil through the ceramic tip. As the soil dries, it tries to remove water from inside the instrument through the tip, creating a measurable tension. This tension is read with either a mechanical gauge or a transducer attached to the instrument. While this is the most direct and accurate method available, there is some maintenance required periodically to replinish water and they must be removed from the field during the winter months to avoid freezing.
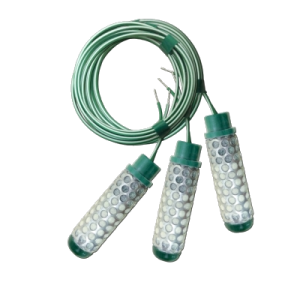
2. WATERMARK Sensor
The WATERMARK Sensor is a "Granular Matrix Sensor" that electronically reads the amount of moisture absorbed through a unique mix of precisely composed materials, or granular matrix. This mix buffers the sensor against the effects of different salinities and ensures a much longer life than traditional "gypsum blocks". WATERMARK readings are calibrated to reflect the same values that would be measured by a Tensiometer. Maintenance free and with an expected life of 5+ years, these sensors can be left in the ground permanently. WATERMARK sensors require minimal power to read and are perfectly suited for data logging or IoT devices.
Selecting the Right Sensor
The following table presents the general characteristics suitable for each sensor type:
| SOIL TYPE | CROP SENSITIVITY | TENSION RANGE | |
|---|---|---|---|
| IRROMETER SR | Lighter to Medium | Sensitive to Medium Sensitivity | 15 to 75 cb |
| IRROMETER LT | Non-Soil Media, Amended Soils, Coarse or Sandy | Very Sensitive | 5 to 20 cb |
| WATERMARK | Medium to Heavy | Medium to Tolerant | 30 to 200 cb |
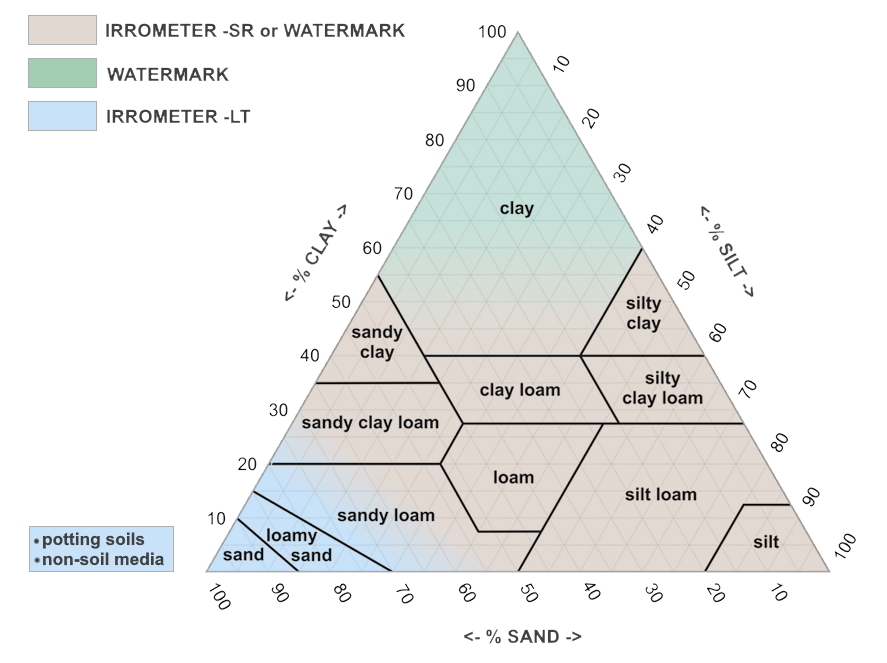
Selection can also be made referencing a traditional soil-type triangle:
Understanding the Data
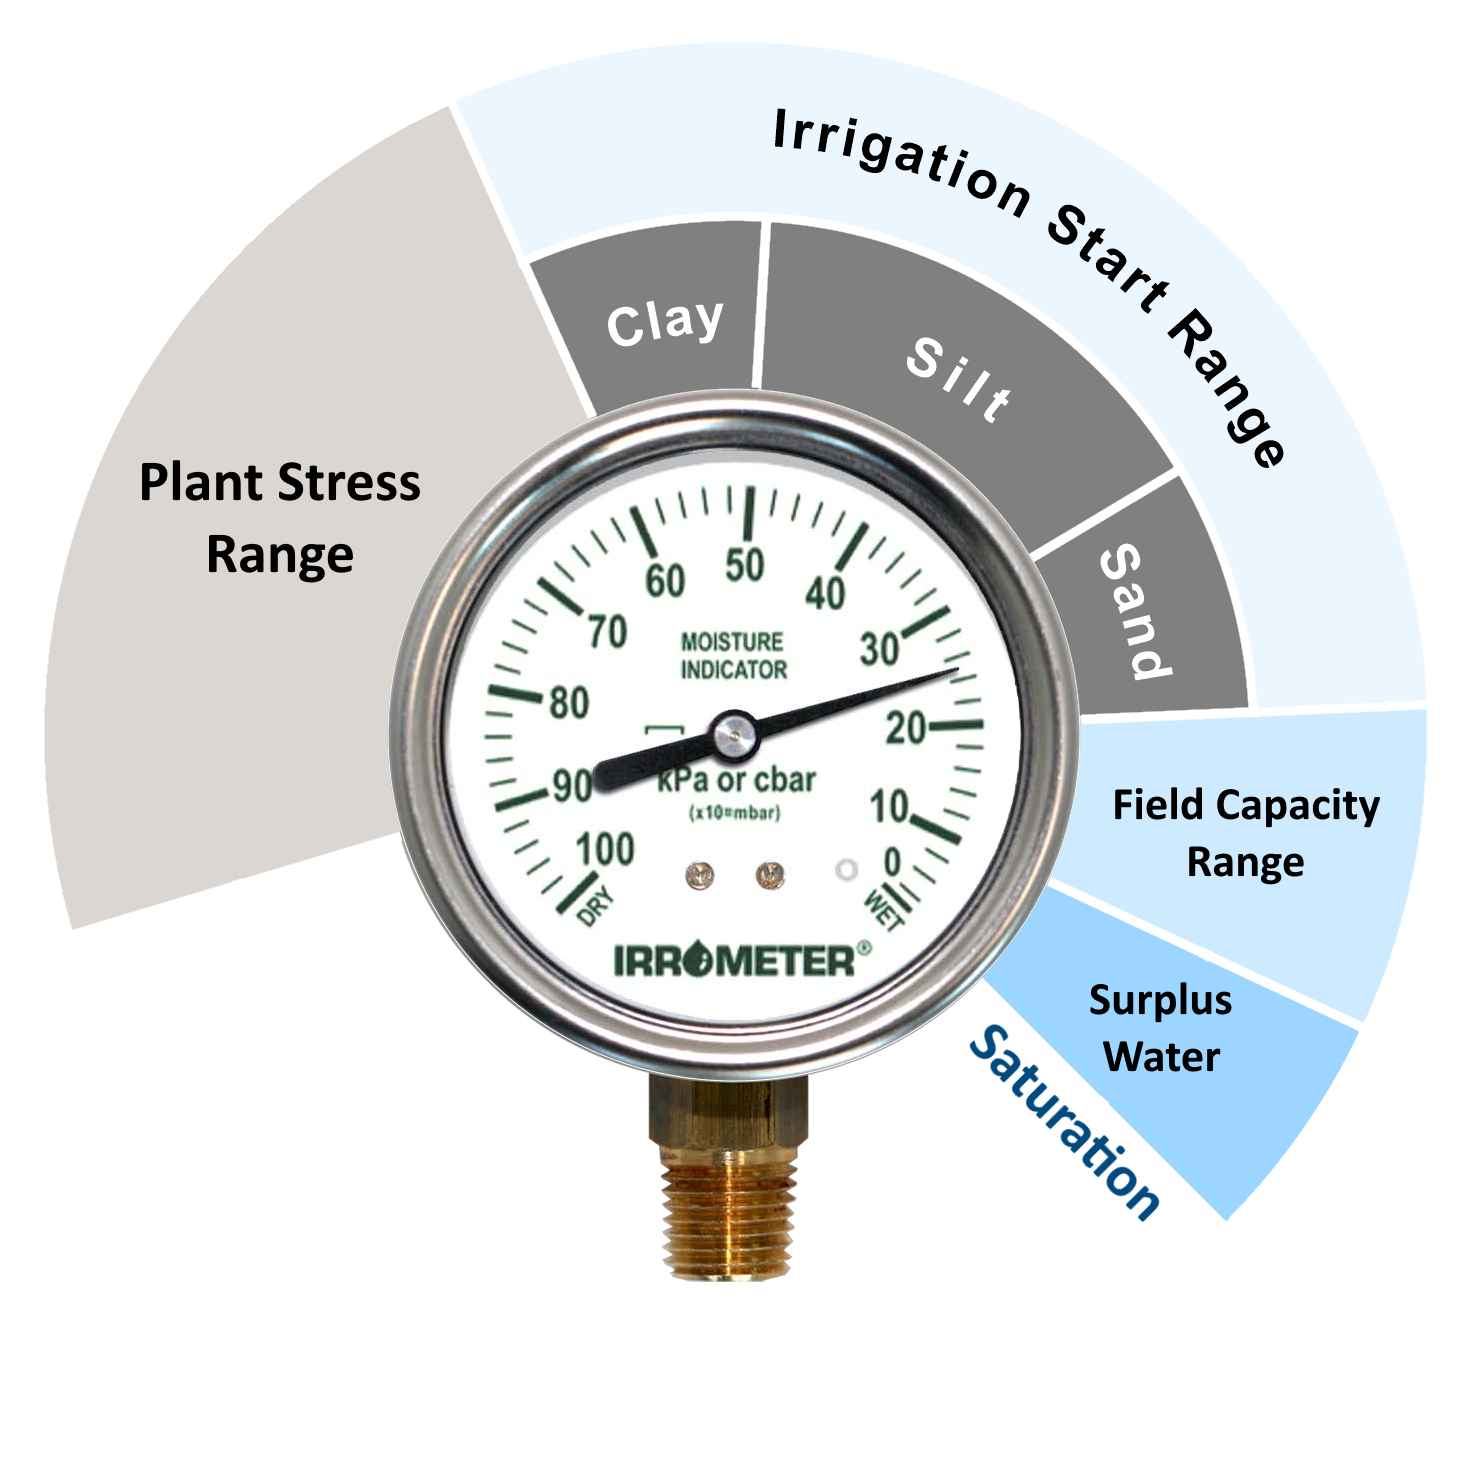
When using either IRROMETER instruments or WATERMARK sensors, use the following readings as general guidelines:
0-10 Centibars = Saturated soil
10-30 Centibars = Soil is adequately wet (except coarse sands, which are drying)
30-60 Centibars = Usual range for irrigation (most soils)
60-100 Centibars = Usual range for irrigation in heavy clay
100-200 Centibars = Soil is becoming dangerously dry- proceed with caution!
Beyond the general guidelines, taking the time to interpret and understand the data will give you more specific thresholds for irrigation and a more accurate picture of what is happening in the root system of your crop. Knowledge of a few basic concepts will help in interpreting the data:
Field Capacity: The amount of soil water held in the soil after excess water has drained away and the rate of downward movement has decreased.
Permanent Wilting Point: The minimal amount of water in the soil that the plant requires not to wilt. This is normally defined as 1500 centibars/kPa.
Available Water: The amount of water that can be stored in a soil profile and be available for growing crops, typically defined as the range between field capacity and the wilting point.
Allowable Depletion: The percentage of available water that can be depleted before irrigation is required to prevent crop stress.
Determining Management Thresholds- WHEN to irrigate
Thresholds are reference points identifying the upper and lower boundaries for managing allowable depletion. This range depends on soil type, crop, plant development, and cultural practices for managing the field, but a typical starting point is to manage between 10% on the wet end and 40-50% on the dry end of available water depletion.
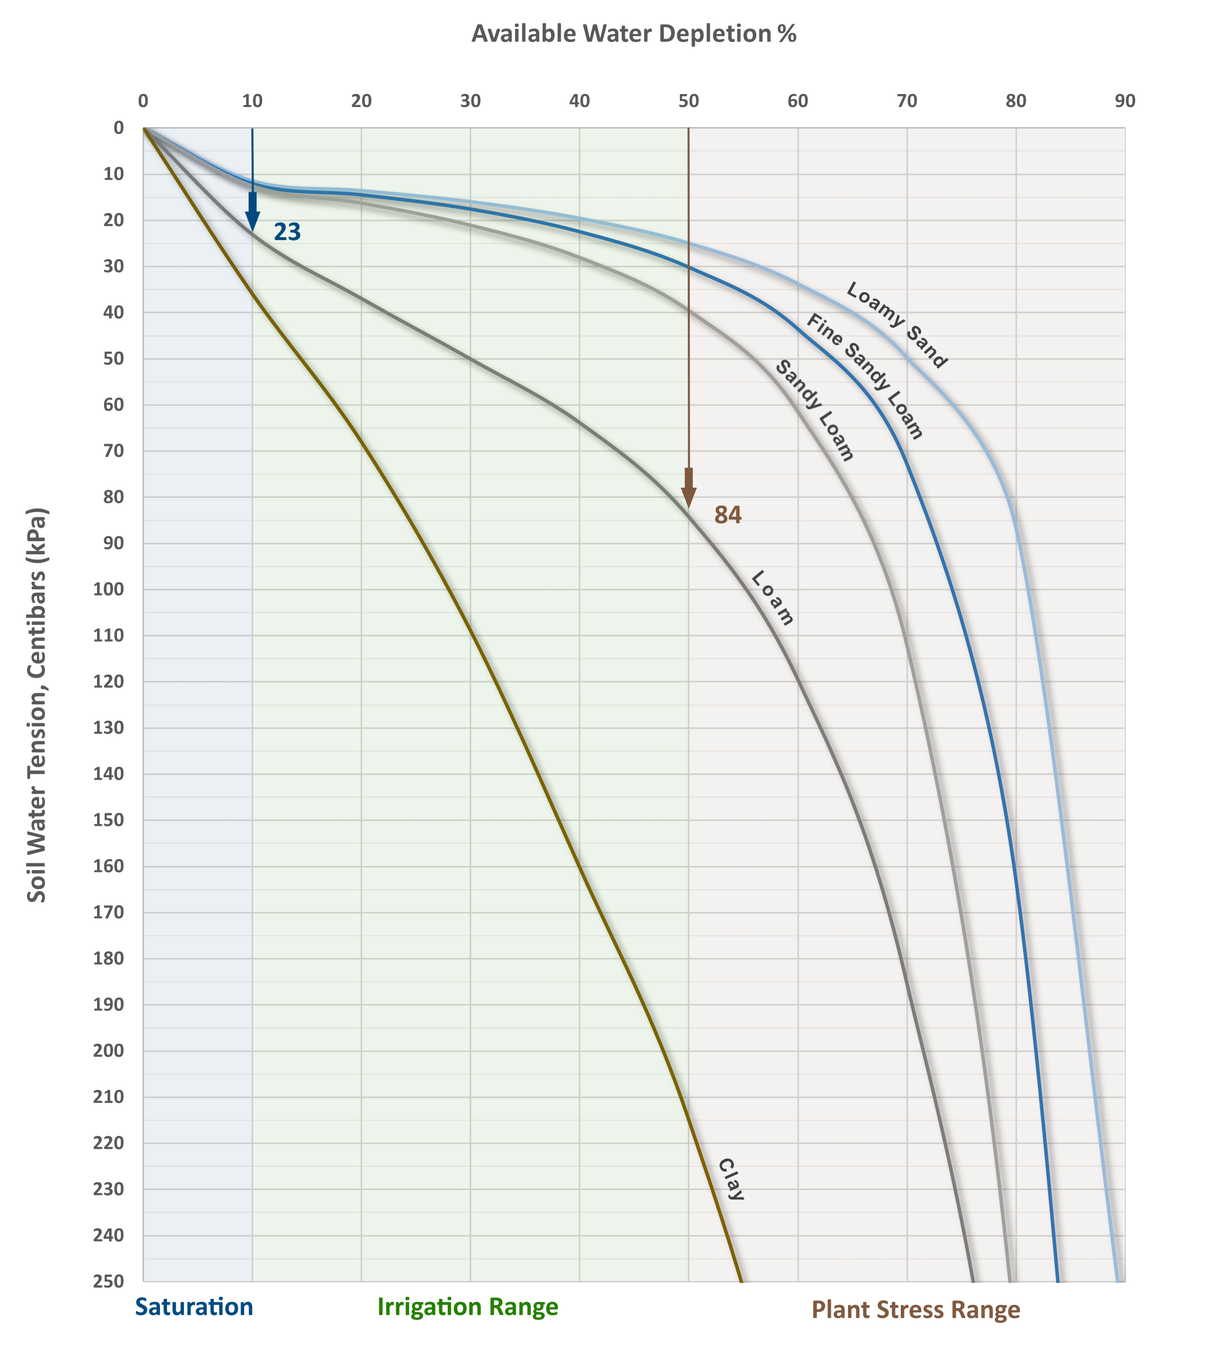
Soil types vary in their ability to hold water, so the available water corresponds to a different range of tension for each soil type. In other words, 50% depletion in a pure loam would be 84 centibars of soil water tension, while in a sandy loam it would be 40 centibars. The following chart visually displays these relationships and provides a reference guide to assist in selecting appropriate threshold levels.
A calculator developed by Clemson University is also available based on this chart which allows you to select a soil type, enter an allowed depletion level, and then input sensor values to determine if irrigation is recommended.
Similar calculators are provided in app form with regionally specific soil information from both University of Nebraska, Lincoln and University of Arkansas Cooperative Extension Service.
The chart to the right demonstrates the relationship between allowed depletion and soil water tension. To use the chart, select the soil type that most closely resembles yours.
Draw a vertical line from 10% available water depletion (represented by the blue/green boundary) down to the curve for your soil type and then horizontally over to the left axis labeled soil water tension to obtain the reference WET value. This will determine the lower (wetter) threshold line.
In this example, for a loam soil this value would be 23 (indicated by the blue arrow).
Next, draw a vertical line from 50% available water depletion (represented by the green/brown boundary) down to the curve for your soil type and then horizontally over to the left axis labeled soil water tension to obtain the reference DRY value. This will determine the higher (drier) threshold line.
In this example, for a loam soil this value would be 84 (indicated by the brown arrow).
Note that the 50% level is a generalized recommendation. Depletion thresholds of between 30% and 50% are typical, with irrigation methods that apply smaller amounts of water per irrigation (such as center pivots) favoring the 30% to 40% range.
There is no substitute for experience and agronomic knowledge to provide the best recommendations. Please consult a crop consultant, farm adviser, NRCS or extension agent for more specific advice on proper soil moisture management.
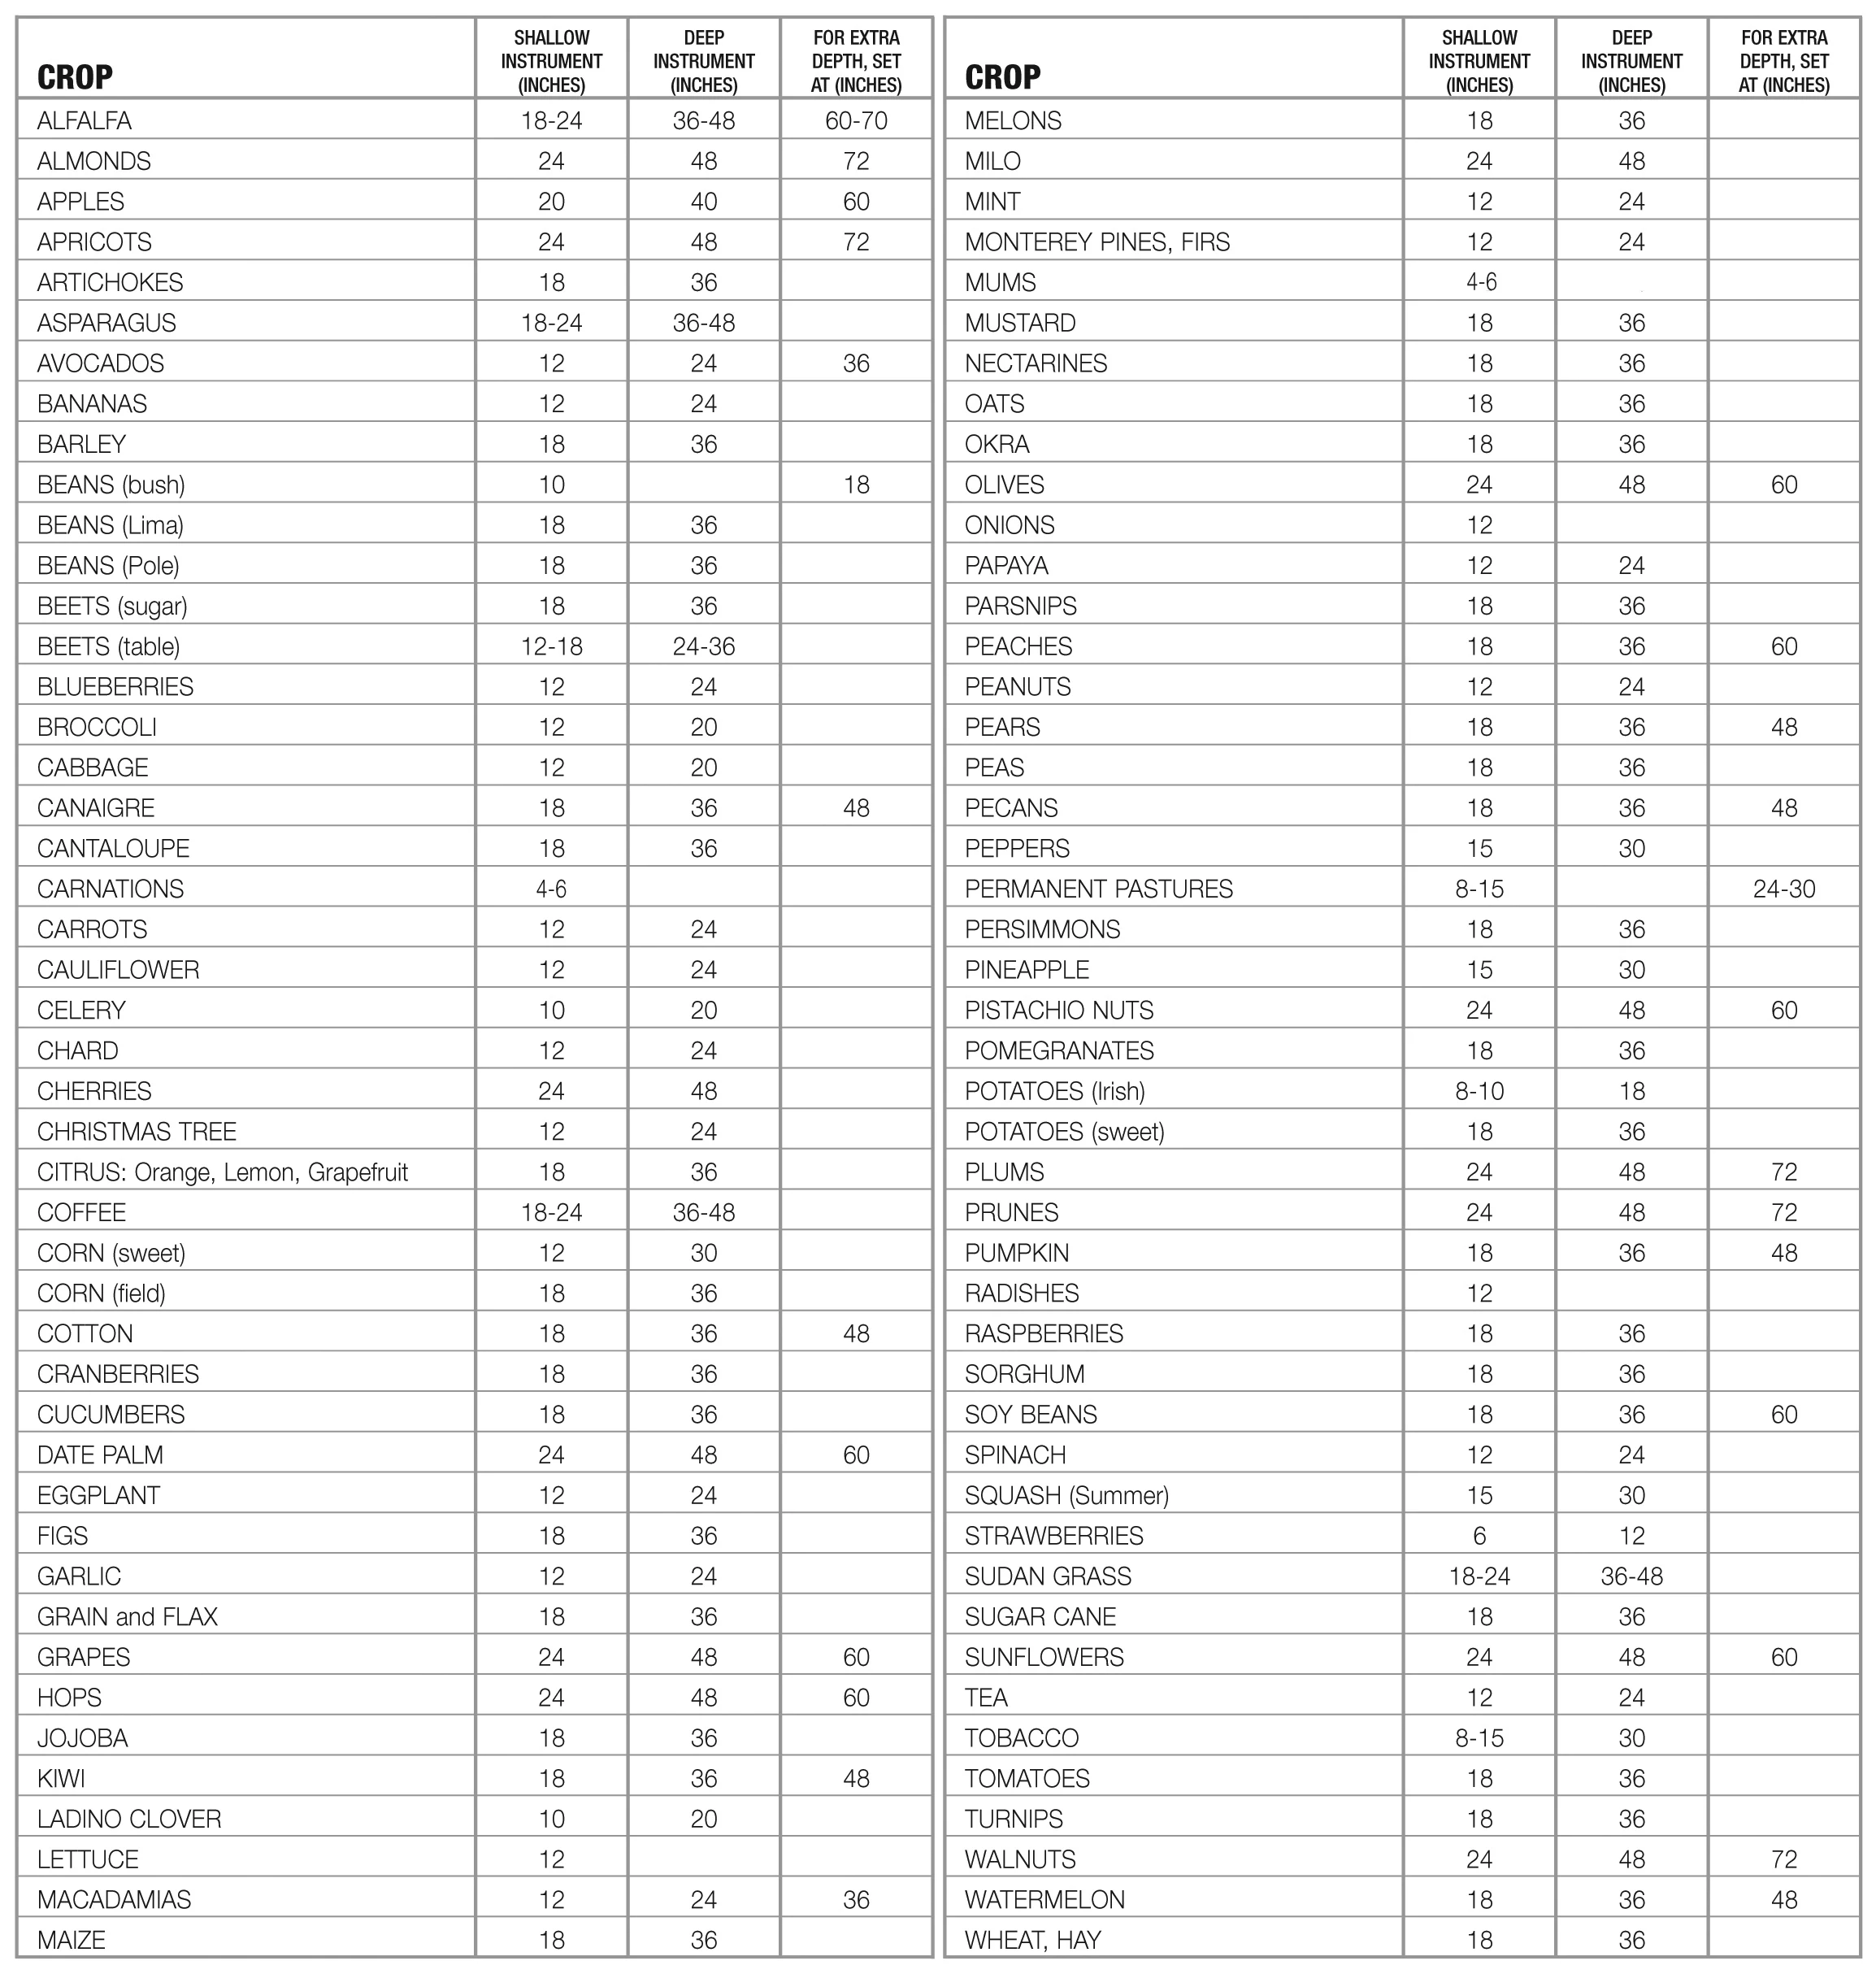
Suggested Placement Depths
The following are suggested placement depths for various crops based on deep, well drained soils. In lighter or shallow soils, place instrument accordingly or set them at an angle. With drip or trickle irrigation 12" and 24" depths are recommended, with an added 36" instrument for deeply rooted crops.
Additional Research
"Principles and Operational Characteristics of Watermark Granular Matrix Sensor to Measure Soil Water Status and its Practical Applications for Irrigation Management in Various Soil Textures"- University of Nebraska
"How to Use Watermark Soil Moisture Sensors for Irrigation"- University of Arkansas
"Nebraska Agricultural Water Management Demonstration Network (NWAMDN): Integrating Research and Extension/Outreach" - University of Nebraska
"Using tensiometers to make irrigation decisions in greenhouse production"- University of California, Davis
"Soil Moisture Monitoring- A Simple Method to Improve Alfalfa and Pasture Irrigation Management"- University of California
"Using Neutron Thermalization, Frequency Domain, Tensiometer, and Granular Matrix Sensor Devices:Relevance to Precision Irrigation" -C.C.Shock et al (2016)
"Electrical Resistance Blocks"- University of California, Davis
"Crop Water Requirement Presentation" -USDA NRCS
"Comparison of the soil matrix potential using tensiometers and WATERMARK sensors"- Oregon State University
"MONITORAMENTO DA IRRIGAÇÃO POR MEIO DA TENSÃO DA ÁGUA DO SOLO"
Crop Specific Research:
"Soil Moisture Monitoring in Drip and Furrow Irrigated Onions"-Washington Irrigator
"Sugarbeet fertilization and irrigation"- Kern County Newsletter
"Wine grapes in California" -CA Farmer
"Control and Automation in Citrus Microirrigation Systems"- University of Florida
"Drip Irrigation and Fertigation Management of Celery"- University of California, Davis
"Water Requirement and Irrigation Management for Optimizing Carrot Yield and Quality"- NSAC
"Avocado Irrigation"- San Diego Country Farm Advisor
"Irrigation Scheduling Optimizes Water Use" - CA Almonds
Waxflower Issue-Floriculture News
"Basic Vegetable Crop Irrigation"- Alabama Cooperative Extension
Soil moisture control of landscape irrigation systems:
Boulder, CO WATERMARK Electronic Module (WEM) Project
Moreno Valley, CA WATERMARK Sensor Project
IA Turf and LandscapeIrrigation Best Management Practices
Soil Moisture Sensor for Urban Landscape- AWRA