Efficient irrigation improves yields, promotes plant health, and conserves resources.
Soil moisture sensors provide visibility in to the root zone, allowing managers to make informed decisions about when and how much to irrigate. While there are many different methods available for estimating irrigation demand, sensors allow for actually measuring it.
Measuring Soil Water
Soil water measurement falls in to two broad categories:
Volumetric measurement- measuring the percentage of water by volume in a given amount of soil
Tensiometric measurement- measuring the physical force holding water in the soil, measured in Centibars (or kPa) of soil water tension
IRROMETER soil moisture measurement is based on the tensiometric method, as the amount of water is less important than how difficult it is for the plant to extract it from the soil.
Soil water tension (or matric potential) has to be overcome for the plant to move water in to its root system. Different soil types will have different tensions even at the same volumetric measurement, making volumetric information relative to local conditions and often requiring site calibration for reading equipment. Because we use soil water tension, there is no site calibration required when using our sensors.
Due to the fact that tensiometers have been used in research since the 1920's and have been commercially available from us since 1951, decades of published research by numerous universities and extension agencies have produced a wide field of reference for recommended tension levels to use with common crops and landscapes.
Sensor Options
There are two methods we offer for reading soil water tension:
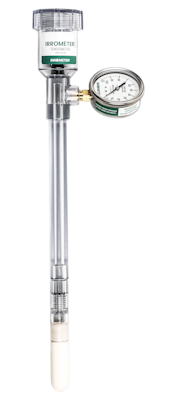
1. IRROMETER Tensiometer
The Tensiometer is the only direct measurement instrument available, which means that it measures the physical forces at work in the soil vs. indirectly measuring an electrical property as other sensors do. Tensiometers act like an artificial root, interacting with the soil through the ceramic tip. As the soil dries, it tries to remove water from inside the instrument through the tip, creating a measurable tension. This tension is read with either a mechanical gauge or a transducer attached to the instrument. While this is the most direct and accurate method available, there is some maintenance required periodically to replinish water and they must be removed from the field during the winter months to avoid freezing.
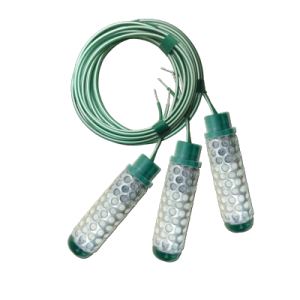
2. WATERMARK Sensor
The WATERMARK Sensor is a "Granular Matrix Sensor" that electronically reads the amount of moisture absorbed through a unique mix of precisely composed materials, or granular matrix. This mix buffers the sensor against the effects of different salinities and ensures a much longer life than traditional "gypsum blocks". WATERMARK readings are calibrated to reflect the same values that would be measured by a Tensiometer. Maintenance free and with an expected life of 5+ years, these sensors can be left in the ground permanently. WATERMARK sensors require minimal power to read and are perfectly suited for data logging or IoT devices.
Selecting the Right Sensor
The following table presents the general characteristics suitable for each sensor type:
| SOIL TYPE | CROP SENSITIVITY | TENSION RANGE | |
|---|---|---|---|
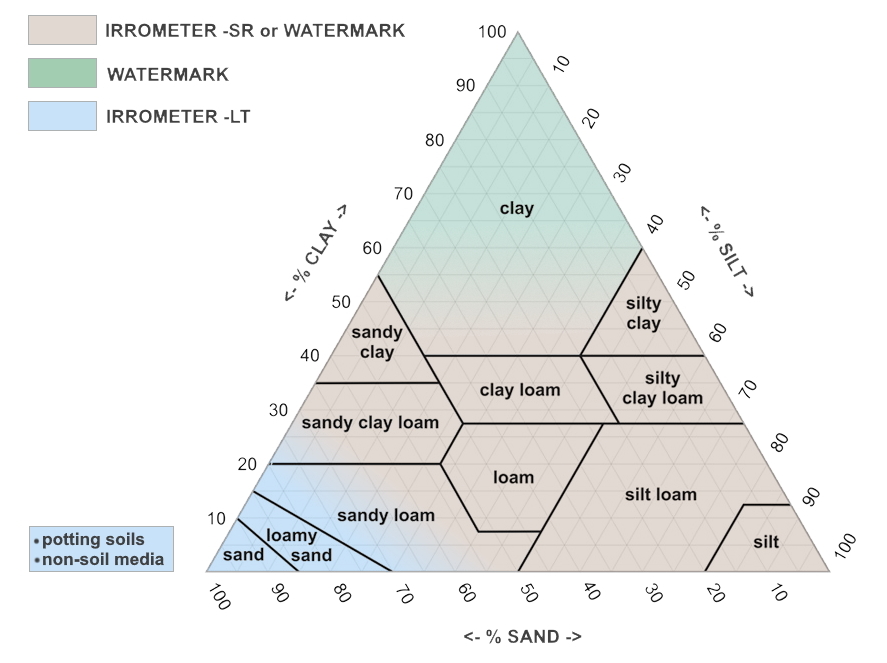
| IRROMETER SR | Lighter to Medium | Sensitive to Medium Sensitivity | 15 to 75 cb |
| IRROMETER LT | Non-Soil Media, Amended Soils, Coarse or Sandy | Very Sensitive | 5 to 20 cb |
| WATERMARK | Medium to Heavy | Medium to Tolerant | 30 to 200 cb |
Selection can also be made referencing a traditional soil-type triangle:
Understanding the Data
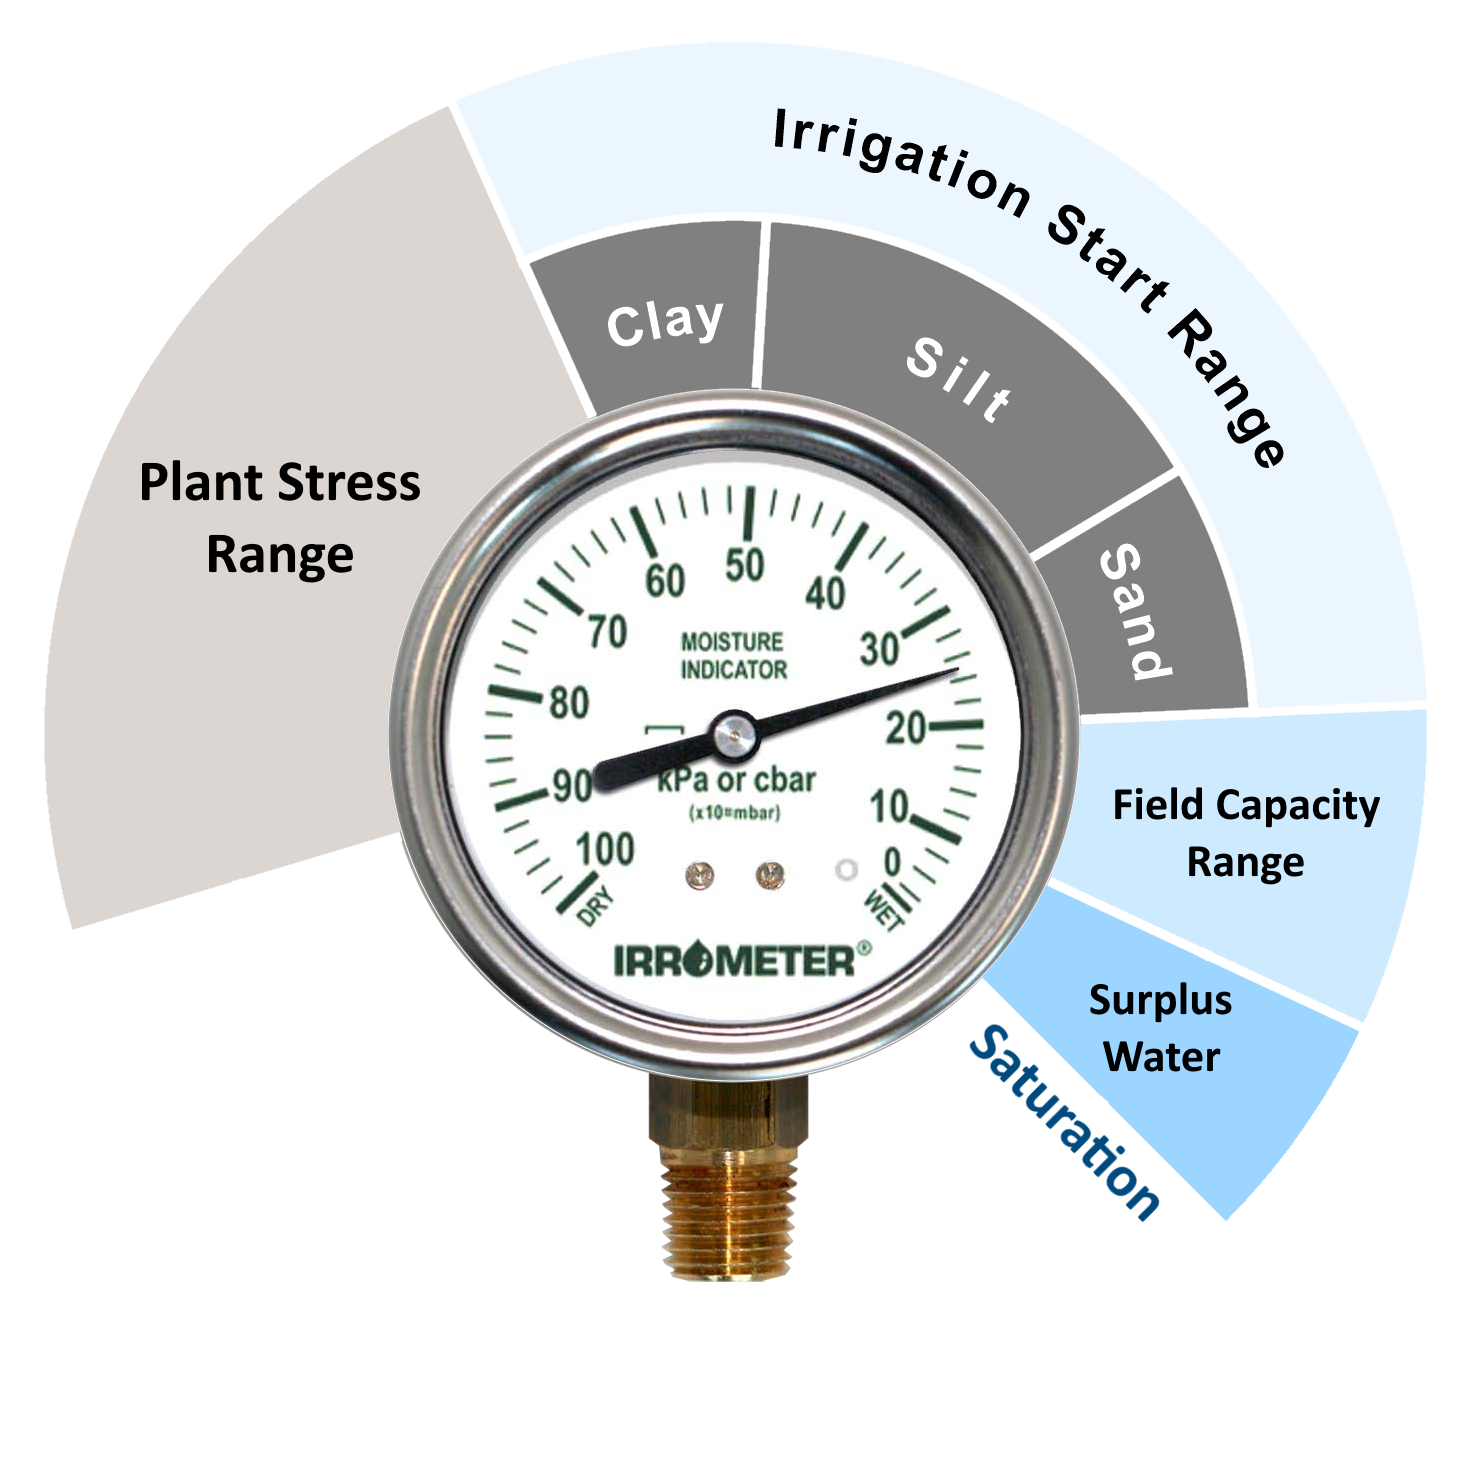
When using either IRROMETER instruments or WATERMARK sensors, use the following readings as general guidelines:
0-10 Centibars = Saturated soil
10-30 Centibars = Soil is adequately wet (except coarse sands, which are drying)
30-60 Centibars = Usual range for irrigation (most soils)
60-100 Centibars = Usual range for irrigation in heavy clay
100-200 Centibars = Soil is becoming dangerously dry- proceed with caution!
Beyond the general guidelines, taking the time to interpret and understand the data will give you more specific thresholds for irrigation and a more accurate picture of what is happening in the root system of your crop. Knowledge of a few basic concepts will help in interpreting the data:
Field Capacity: The amount of soil water held in the soil after excess water has drained away and the rate of downward movement has decreased.
Permanent Wilting Point: The minimal amount of water in the soil that the plant requires not to wilt. This is normally defined as 1500 centibars/kPa.
Available Water: The amount of water that can be stored in a soil profile and be available for growing crops, typically defined as the range between field capacity and the wilting point.
Allowable Depletion: The percentage of available water that can be depleted before irrigation is required to prevent crop stress.
Installing and Preparing Sensors
SELECTING INSTALLTION SITES - WATERMARK or IRROMETER TENSIOMETER
The following guidlines will help in choosing measurement sites. As with all sensors, common sense is important here- if the sensors aren't in the wetted area where the roots are extracting water, the value of the information will be minimal.
Proper placement of sensors is critical to providing actionable data. Select sites that are representative of a larger block of similar conditions such as soil type, slope, and sun exposure.
Install sensors into the active root zone of the plant and in the wetted area of the irrigation system, preferably on the side with more direct sunlight where evaporative losses are greatest.
Plants with root systems deeper than 18” (45 cm) can benefit from measuring at multiple depths to better understand the soil moisture profile. A good starting point is to install the shallow sensor at 25% of the root zone depth, and the deeper at 75%.
For trees, place sensors at the drip line of the canopy, while in row crops place in the row itself. With drip or micro-sprinkler systems, placement is recommended at 12” (30 cm) to 18” (45 cm) from the emitter line, or 24” (60 cm) to 36” (90 cm) from the sprinkler within the wetted pattern.
In flood or furrow applications, place sensors two-thirds of the way down the run where penetration is most critical.
WATERMARK SENSOR INSTALLATION
Pipe Vs. No Pipe Installation
WATERMARK 200SS Sensors can be installed as sold directly in the soil, or optionally with PVC pipe attached to protect the wires and ease installation. Assuming proper installation, either option will provide the same data and is a matter of user preference.
For the pipe option, a length of 1/2" Class 315 PVC (thin wall SDR 13.5) or 3/4" CPVC (SDR 11) pipe will fit snugly over the sensor’s collar and can be solvent welded using a PVC to ABS transition cement. Apply cement sparingly, do not allow it to block the wire penetrations at the top of the sensor. A small hole is recommended to be drilled in the pipe just above the sensor. Do not leave the top of the pipe exposed to irrigation or rainwater, but do not air-tight seal the pipe. A 1/2" vinyl pipe cap (IRROMETER PN: VTC) pushed over the pipe and wires accomplishes this simply.
Conditioning
Several cycles of wetting and drying are required for the WATERMARK sensor matrix to stabilize and provide the best results. This can happen in the ground after installation or can be done pre-install by submerging sensors in the evening for a few minutes and allowing them to dry (hanging vertically) until the next evening. Repeat this process for 2 to 3 cycles as time allows. Always install a wet sensor by submerging them in water for at least 5 minutes prior to installation.
Installing
Drive a hole into the ground with an IRROMETER Installing Tool or a section of ½” steel pipe (7/8” or 22 mm O.D.) to the desired depth
IMPORTANT: A complete bond between the soil and the sensor is critical for good results. To achieve this, make a thick slurry using local soil and water. Coat the white part of the sensor in this slurry and fill the bottom of the hole with it. Push the sensor down into the slurry to the bottom of the hole, “grouting” it to the soil for maximum contact. If not installed on pipe, backfill the hole with the same slurry. If installed on pipe, slurry around the exposed pipe to ensure water doesn't have a direct path down to the sensor along the pipe.
If multiple sensors are installed, labeling the wires or the pipe at this point will aid in identification later.
IRROMETER TENSIOMETER INSTALLATION
Preparation
Take the plastic wrapper off the tip, remove the cap, and fill the IRROMETER with a diluted solution of the green fluid (1 capful of concentrate to 1 gallon of water) to about ¾ of the reservoir. The green fluid is optional but makes determining the water level for servicing easier.
Tap the top of the IRROMETER with the palm of your hand to force water down into the water tube, until there is no bubble between the reservoir and the water tube. Leave the instrument cap off and place the tip of the IRROMETER in clean water for at least 1 hour.
If transporting after soaking, keep the instrument ready for installation by putting the plastic wrapper back on the tip, securing with the rubber band, and installing the cap by tightening only ¼ turn past first contact with the stopper.
Installing
In very loose soils, shorter length instruments can be simply pushed into the soil to the desired depth. Most heavier soils will require preparing a hole for the IRROMETER.
Drive a hole into the ground with an IRROMETER Installing Tool or a section of ½” steel pipe (7/8” or 22 mm O.D.) to the desired depth, leaving at least 1” (25 mm) of space between the bottom of the gauge and the ground to protect the gauge and allow the membrane vent to function.
It is important not to make an overly large hole, as the IRROMETER must be firmly seated to make the necessary contact between the tip and the soil. If a larger hole is necessary, make a mud slurry to fill the hole before installing the instrument to “grout” it in place.
Do not make the hole deeper than the instrument length- the tip should be against the bottom of the hole.
Determining Management Thresholds- WHEN to irrigate
Thresholds are reference points identifying the upper and lower boundaries for managing allowable depletion. This range depends on soil type, crop, plant development, and cultural practices for managing the field, but a typical starting point is to manage between 10% on the wet end and 40-50% on the dry end of available water depletion.
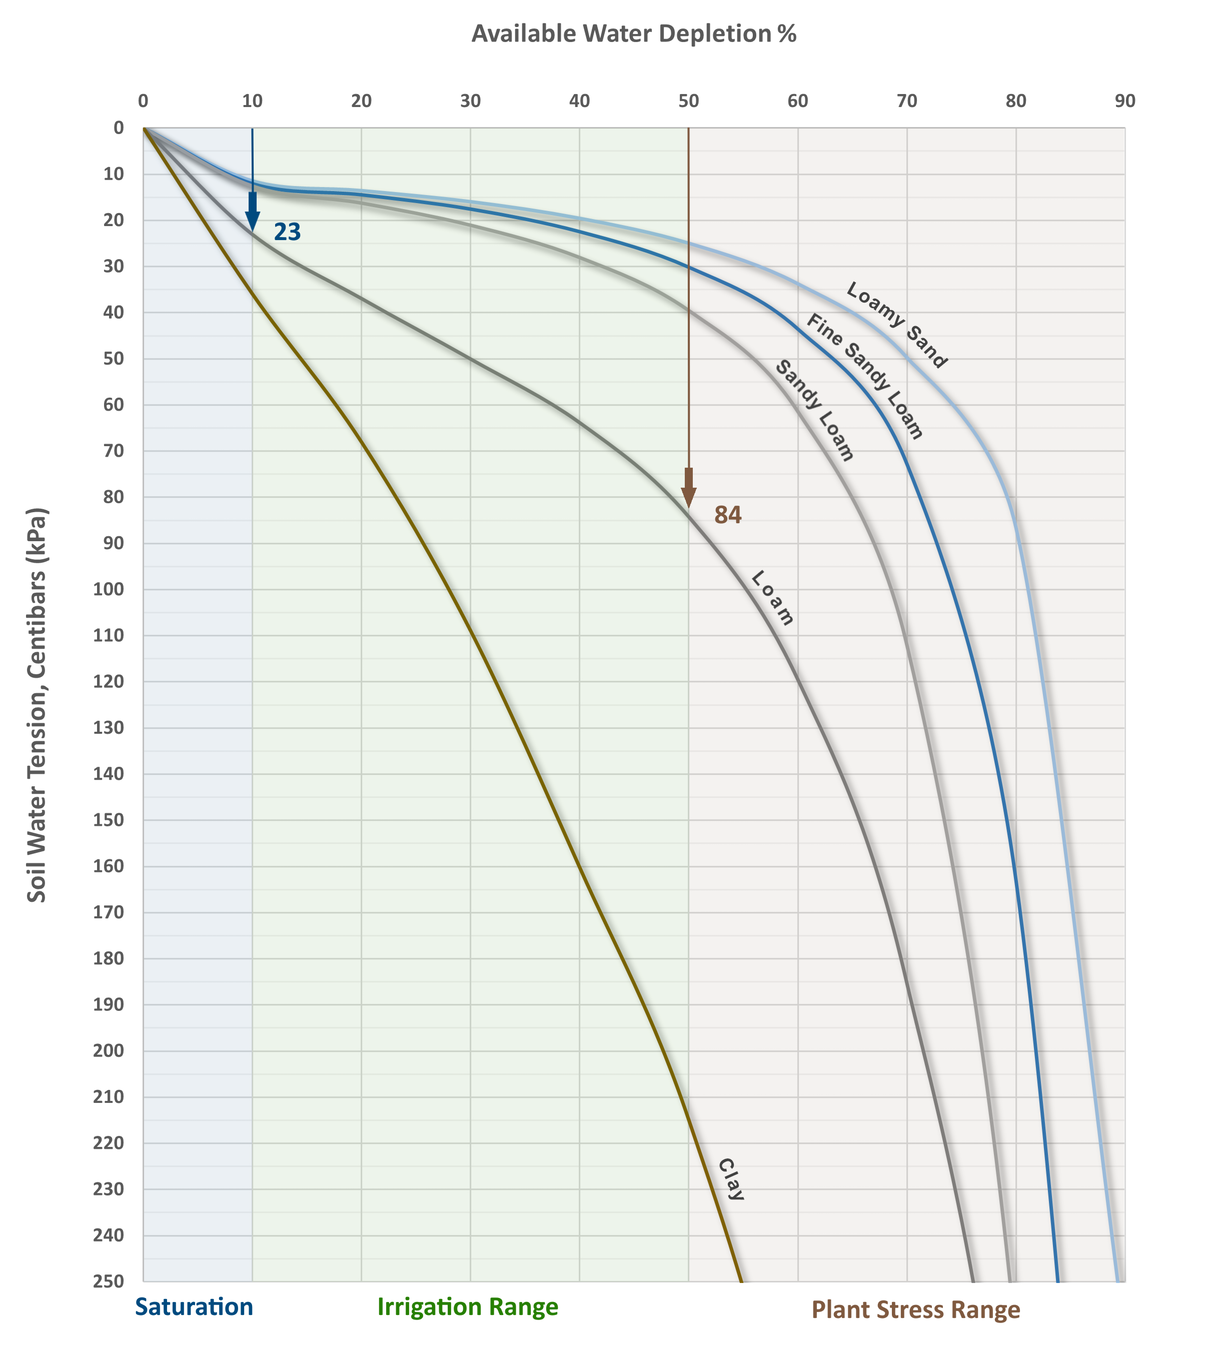
Soil types vary in their ability to hold water, so the available water corresponds to a different range of tension for each soil type. In other words, 50% depletion in a pure loam would be 84 centibars of soil water tension, while in a sandy loam it would be 40 centibars. The following chart visually displays these relationships and provides a reference guide to assist in selecting appropriate threshold levels.
A calculator developed by Clemson University is also available based on this chart which allows you to select a soil type, enter an allowed depletion level, and then input sensor values to determine if irrigation is recommended.
Similar calculators are provided in app form with regionally specific soil information from both University of Nebraska, Lincoln and University of Arkansas Cooperative Extension Service.
The chart to the right demonstrates the relationship between allowed depletion and soil water tension. To use the chart, select the soil type that most closely resembles yours.
Draw a vertical line from 10% available water depletion (represented by the blue/green boundary) down to the curve for your soil type and then horizontally over to the left axis labeled soil water tension to obtain the reference WET value. This will determine the lower (wetter) threshold line.
In this example, for a loam soil this value would be 23 (indicated by the blue arrow).
Next, draw a vertical line from 50% available water depletion (represented by the green/brown boundary) down to the curve for your soil type and then horizontally over to the left axis labeled soil water tension to obtain the reference DRY value. This will determine the higher (drier) threshold line.
In this example, for a loam soil this value would be 84 (indicated by the brown arrow).
Note that the 50% level is a generalized recommendation. Depletion thresholds of between 30% and 50% are typical, with irrigation methods that apply smaller amounts of water per irrigation (such as center pivots) favoring the 30% to 40% range.
There is no substitute for experience and agronomic knowledge to provide the best recommendations. Please consult a crop consultant, farm adviser, NRCS or extension agent for more specific advice on proper soil moisture management.
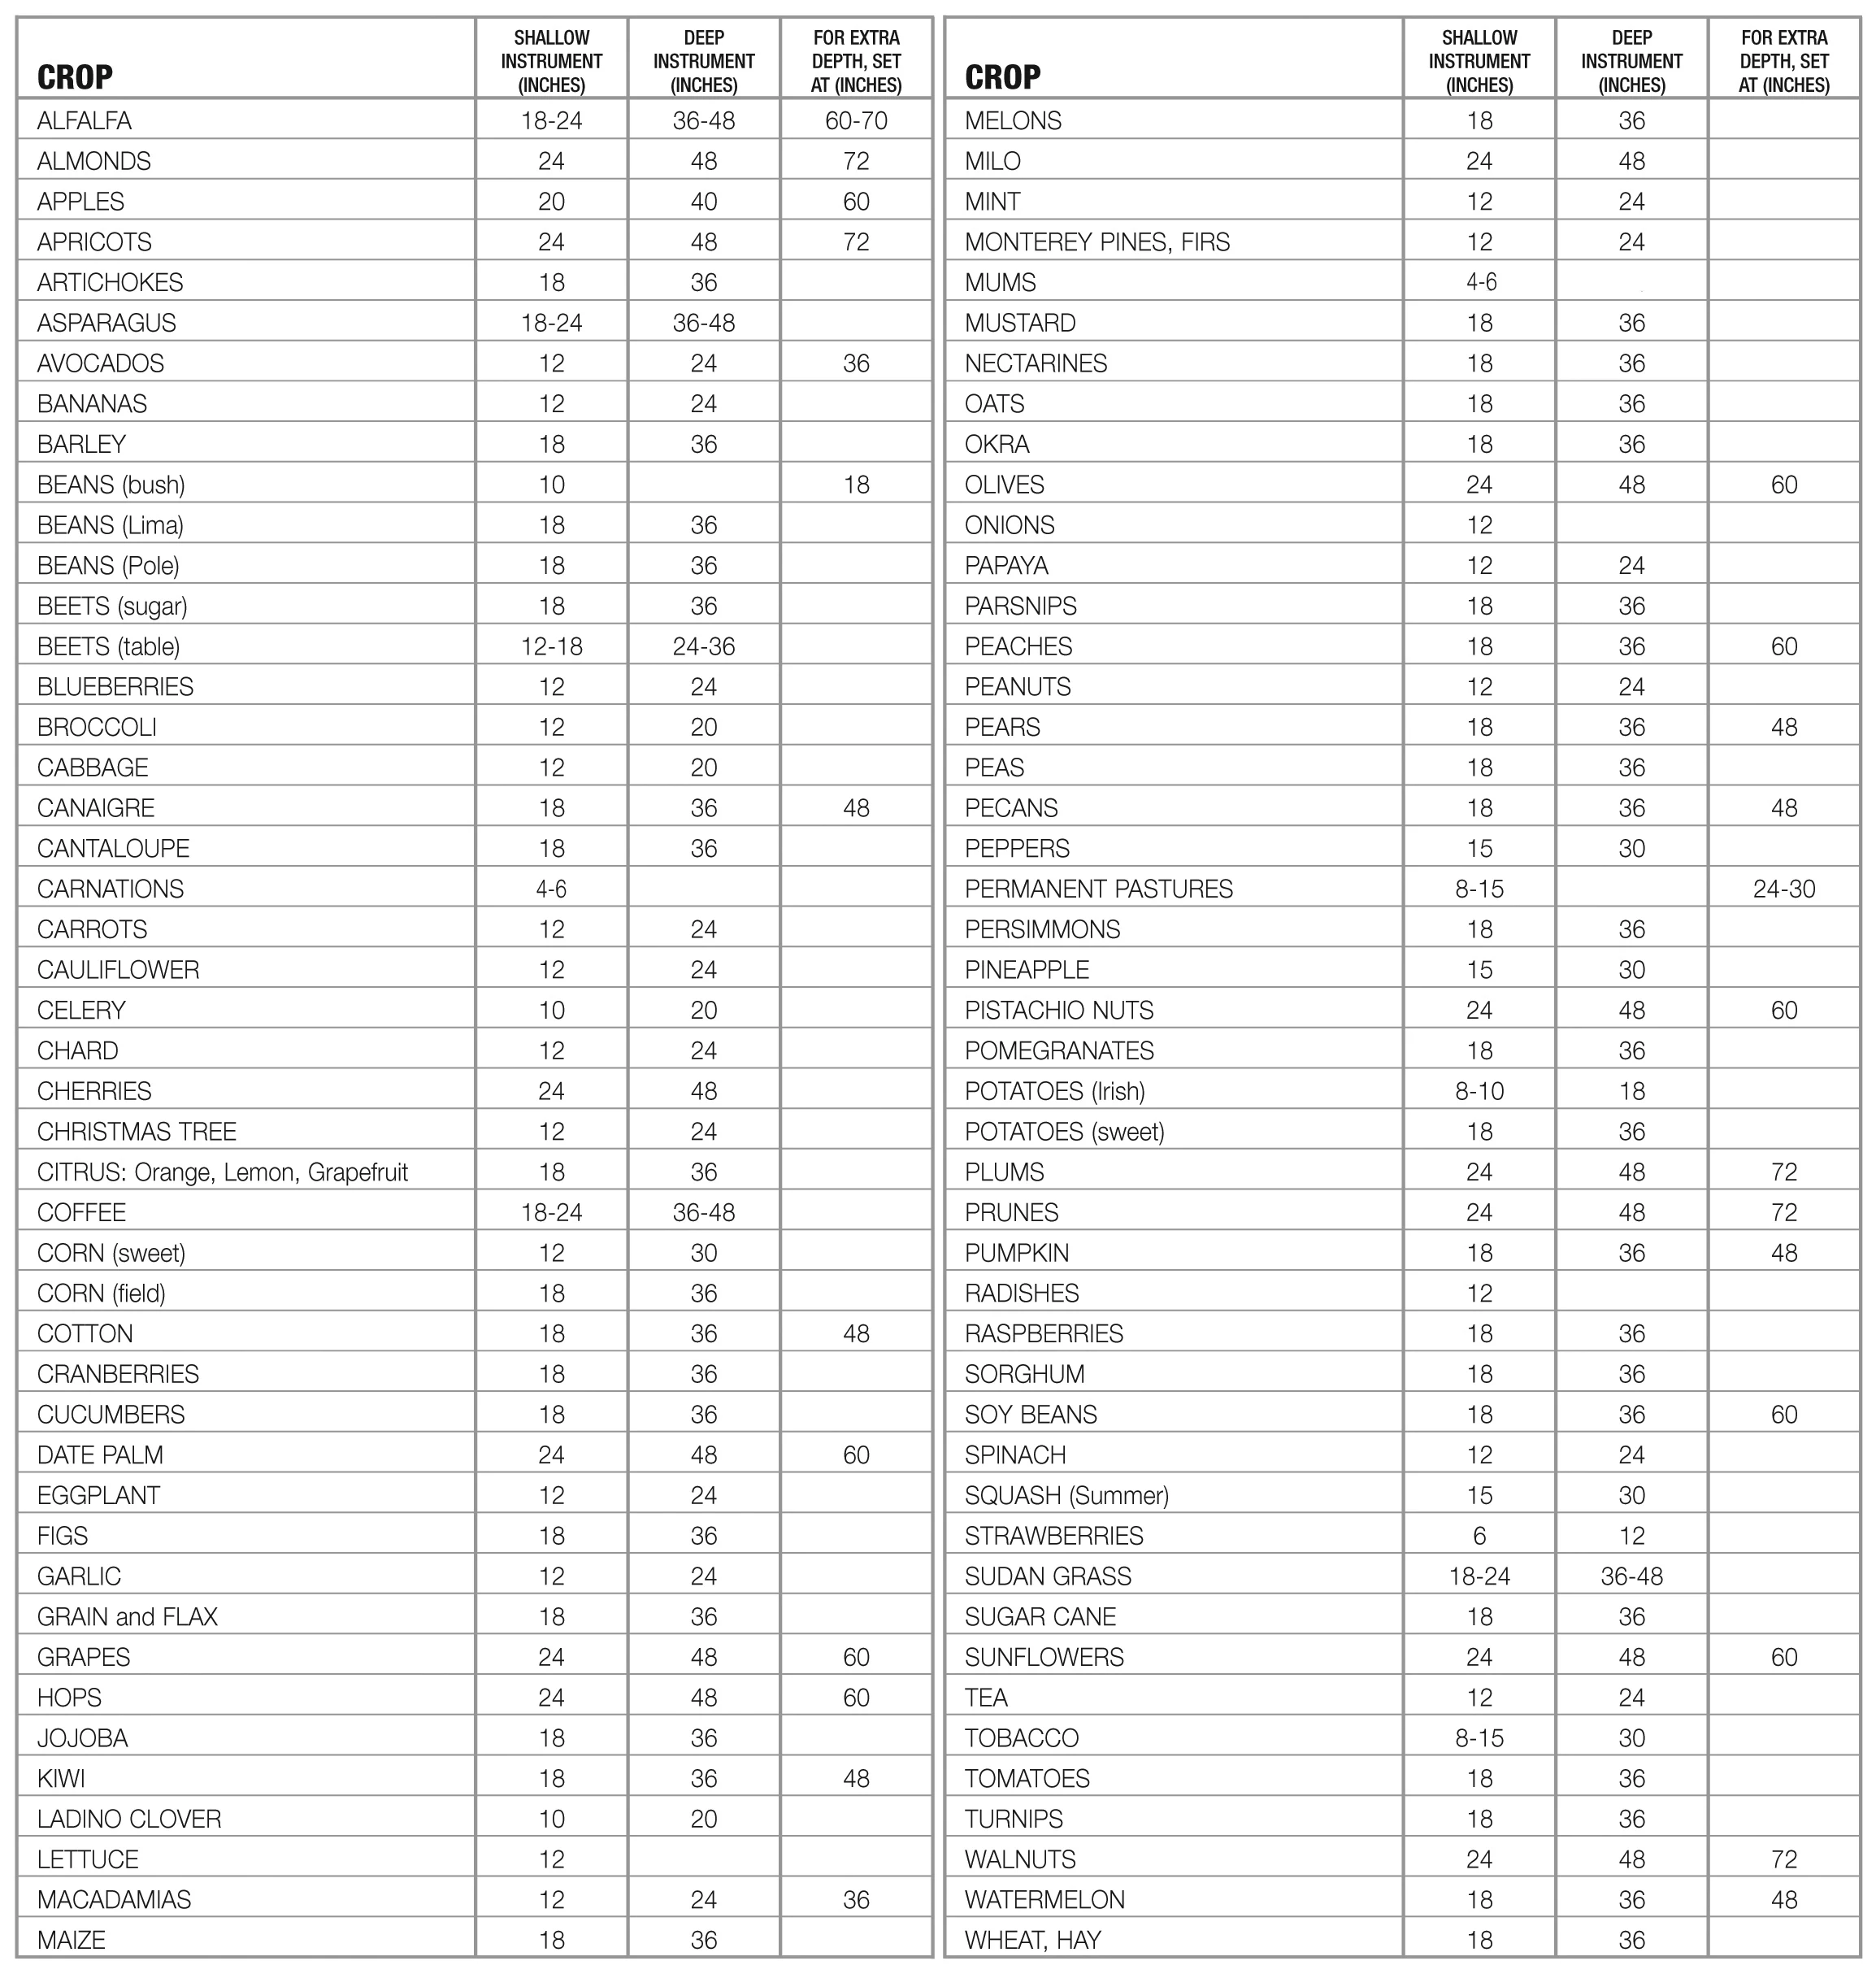
Suggested Placement Depths
The following are suggested placement depths for various crops based on deep, well drained soils. In lighter or shallow soils, place instrument accordingly or set them at an angle. With drip or trickle irrigation 12" and 24" depths are recommended, with an added 36" instrument for deeply rooted crops.
Additional Research
Sensor-based scheduling reduced irrigation by 50% - Mississippi State University and University of Arkansas
Irrigation water management practices increased irrigation water use efficiency by 51.3% - Mississippi State University and University of Arkansas
"Principles and Operational Characteristics of Watermark Granular Matrix Sensor to Measure Soil Water Status and its Practical Applications for Irrigation Management in Various Soil Textures"- University of Nebraska
"How to Use Watermark Soil Moisture Sensors for Irrigation"- University of Arkansas
"Nebraska Agricultural Water Management Demonstration Network (NWAMDN): Integrating Research and Extension/Outreach" - University of Nebraska
"Using tensiometers to make irrigation decisions in greenhouse production"- University of California, Davis
"Soil Moisture Monitoring- A Simple Method to Improve Alfalfa and Pasture Irrigation Management"- University of California
"Using Neutron Thermalization, Frequency Domain, Tensiometer, and Granular Matrix Sensor Devices:Relevance to Precision Irrigation" -C.C.Shock et al (2016)
"Electrical Resistance Blocks"- University of California, Davis
"Crop Water Requirement Presentation" -USDA NRCS
"Comparison of the soil matrix potential using tensiometers and WATERMARK sensors"- Oregon State University
"MONITORAMENTO DA IRRIGAÇÃO POR MEIO DA TENSÃO DA ÁGUA DO SOLO"
Crop Specific Research:
"Soil Moisture Monitoring in Drip and Furrow Irrigated Onions"-Washington Irrigator
"Sugarbeet fertilization and irrigation"- Kern County Newsletter
"Wine grapes in California" -CA Farmer
"Control and Automation in Citrus Microirrigation Systems"- University of Florida
"Drip Irrigation and Fertigation Management of Celery"- University of California, Davis
"Water Requirement and Irrigation Management for Optimizing Carrot Yield and Quality"- NSAC
"Avocado Irrigation"- San Diego Country Farm Advisor
"Irrigation Scheduling Optimizes Water Use" - CA Almonds
Waxflower Issue-Floriculture News
"Basic Vegetable Crop Irrigation"- Alabama Cooperative Extension
Soil moisture control of landscape irrigation systems:
Boulder, CO WATERMARK Electronic Module (WEM) Project
Moreno Valley, CA WATERMARK Sensor Project
IA Turf and LandscapeIrrigation Best Management Practices
Soil Moisture Sensor for Urban Landscape- AWRA